# The B-tree does the heavy lifting
> How a B-tree finds a row in three or four page reads, how to order its columns, and how to spot the indexes that cost more than they give.
---
LLMS index: [llms.txt](/en/llms.txt)
---
Most slow queries aren't doing anything hard. They're reading the whole table to find a handful of rows, every time, because nobody told Postgres where to look.
Here's one, run whenever someone opens a project page:
```sql
explain (analyze, buffers)
select * from events
where project_id = 4242
order by created_at desc
limit 20;
```
```text
Limit ... (actual time=24.828..25.941 rows=20.00 loops=1)
Buffers: shared hit=358 read=34891
...
-> Parallel Seq Scan on events ...
Rows Removed by Filter: 666638
```
It read 35,249 pages to return 20 rows: every one of the table's 35,173 pages (all 275 MB of `events`), plus a few dozen for planning and the sort, every time the page loads. On our laptop, with the table in memory, that took 26 ms, which is why nobody noticed. On a production box with a cold cache and fifty people opening dashboards at once, it's the query that takes the database down.
> [!EXAMPLE]- Prove it · lab `16-btree`
>
> ```sql
> select lab.prove('with no index, the dashboard query reads the whole table (about 35,249 pages)',
> lab.buffers($$ select * from events where project_id = 4242
> order by created_at desc limit 20 $$) between 35173 and 35400);
> ```
>
> [Full lab script](https://www.flagon.io/books/eight-kilobytes/lab/16-btree.sql)
After the right `create index`, it reads 23 pages. That's the cheapest speedup you'll ever buy, and this chapter is about buying it on purpose while refusing the indexes that only cost you. In every plan, watch the `Buffers:` line, which counts 8 KB pages. Pages are the evidence; milliseconds are weather ([Buffers are the evidence](/en/19-explain/#buffers-are-the-evidence)).
## A B-tree is a shallow tree of pages
Think of a library card catalog: the cabinet sign picks the drawer, the tabs pick the card, and the card names the shelf. You never read the whole catalog. A B-tree is that catalog, built from 8 KB pages, and the shelf is the **heap**: the table itself, an unordered pile of pages ([Everything is a page](/en/04-storage/#basics-chapter-4)). Here is the primary key of `events`:
**Figure 17-1.** A lookup reads one page per level\, then the heap\. The primary key of events is 1 root page\, 19 internal pages and 5\,465 leaves over a heap of 35\,173 pages\, so finding a row reads three pages in the tree and one in the heap\.
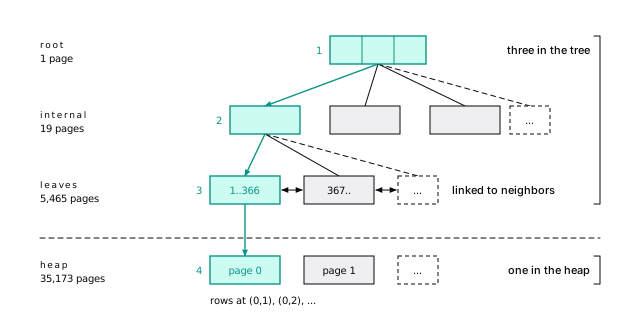
The **leaves** hold every key in order, each with a **TID**, the row's `(page, item)` address in the heap (its [ctid](/en/04-storage/#a-line-pointer-lets-a-tuple-move-without-changing-its-address)), and link to their neighbors so range scans walk sideways. The pages above only say which child to visit next.
The shape is the whole trick. Each internal page points at roughly 300 children, so three levels hold about 30 million keys and four about 10 billion. Grow the table three-hundredfold and a lookup costs one more page. In [A query is pages and round trips](/en/03-latency/#a-query-is-pages-and-round-trips), a primary key lookup read four: three in the tree, one in the heap. Hold on to that:
**An index lookup costs the depth of the tree plus one heap page per matching row.**
The tree's share is three or four pages and barely grows. The heap pages are where the money goes, and the rest of this chapter is about spending fewer of them.
> [!NOTE] Coming from MySQL
>
> There's no clustered index: every index, the primary key included, points into an unordered heap ([The table is the primary key in InnoDB](/en/11-not-mysql/#the-table-is-the-primary-key-in-innodb)).
> [!DETAILS]- Deep dive: What pageinspect shows inside the primary key
>
> Block 0 of every B-tree is a **metapage** that records where the root is. `pageinspect` reads it and summarizes every page (`bt_multi_page_stats` is PostgreSQL 16+):
>
> ```sql
> select root, level from bt_metap('events_pkey');
>
> select type, count(*) as pages, round(avg(live_items)) as avg_items
> from bt_multi_page_stats('events_pkey', 1, -1)
> group by type;
> ```
>
> ```text
> root | level
> ------+-------
> 412 | 2
>
> type | pages | avg_items
> ------+-------+-----------
> r | 1 | 19
> i | 19 | 289
> l | 5465 | 367
> ```
>
> Root at block 412, level 2: three levels. Nineteen internal pages point at about 289 leaves each, and 5,465 leaves hold about 367 entries of 16 bytes (an 8-byte key plus an 8-byte header carrying the TID). One slot per leaf is the **high key**, the page's upper bound (the first leaf's is 367, the first id on the next leaf), so 5,465 leaves of 366 rows is the two million.
>
> > [!EXAMPLE]- Prove it · lab `16-btree`
> >
> > ```sql
> > select lab.prove('5,465 leaves holding about 367 entries of 16 bytes',
> > (select count(*) = 5465 and round(avg(live_items)) = 367 and round(avg(avg_item_size)) = 16
> > from bt_multi_page_stats('events_pkey', 1, -1) where type = 'l'));
> > ```
> >
> > [Full lab script](https://www.flagon.io/books/eight-kilobytes/lab/16-btree.sql)
## The first index: 35,249 pages to 91
Start with the obvious index, on the `where` column:
```sql
create index events_project_id_idx on events (project_id);
```
```text
Limit ... (actual time=0.107..0.109 rows=20.00 loops=1)
Buffers: shared hit=91
-> Sort ...
-> Bitmap Heap Scan on events ... rows=85.00 ...
Heap Blocks: exact=85
-> Bitmap Index Scan on events_project_id_idx ...
Buffers: shared hit=3
```
From 35,249 pages to 91. Read it bottom up:
- **The index:** 3 pages to find all 85 of the project's rows.
- **The heap:** 85 pages, one per row (`Heap Blocks: exact=85`). The events arrived at random times over the year, so each landed on a different page.
- **The sort:** kept the newest 20.
Three pages to find, 85 to fetch. That ratio is normal.
> [!EXAMPLE]- Prove it · lab `16-btree`
>
> ```sql
> create index events_project_id_idx on events (project_id);
>
> select lab.prove('the dashboard query now reads about 91 pages',
> lab.warm_buffers($$ select * from events where project_id = 4242
> order by created_at desc limit 20 $$) between 85 and 100);
> ```
>
> [Full lab script](https://www.flagon.io/books/eight-kilobytes/lab/16-btree.sql)
## An index helps only as much as its rows sit together
Finding rows in an index is cheap. Fetching them from the heap is the bill, and Postgres has three ways to settle it. An **Index Scan** fetches each row as it walks the index, so rows come out sorted. A **bitmap scan**, the plan above, collects every match first, then visits each heap page once, in physical order. An **index-only scan** skips the heap altogether.
Here's the uncomfortable truth: **an index helps only as much as the matching rows sit together in the heap.** Ask for 2% of `events` by a range of projects and those rows are spread over 68% of its pages. Past some point, reading the whole table in order is cheaper, and the planner switches to a sequential scan. That isn't the planner being dumb. It's the planner counting pages.
> [!DETAILS]- Deep dive: Why 2% of the rows can cost 68% of the table
>
> About 40,000 rows from a range of projects:
>
> ```sql
> explain (analyze, buffers)
> select * from events where project_id between 4000 and 4400;
> ```
>
> ```text
> Bitmap Heap Scan on events ... (actual time=4.074..83.678 rows=39827.00 loops=1)
> Recheck Cond: ((project_id >= 4000) AND (project_id <= 4400))
> Heap Blocks: exact=23913
> -> Bitmap Index Scan on events_project_id_idx ...
> Buffers: shared hit=3 read=34
> ```
>
> The index cost 37 pages; the heap, 23,913. `Recheck Cond` is the heap scan re-testing each row. If the bitmap outgrows `work_mem`, the memory one operation may use, it goes **lossy**, remembering whole pages instead of rows (`Heap Blocks: exact=... lossy=...`), and the recheck filters every row on those pages.
>
> > [!EXAMPLE]- Prove it · lab `16-btree`
> >
> > ```sql
> > select lab.prove('the index part costs under 50 pages, the heap part about 23,913 pages (68% of the table)',
> > (select lab.field(p, 'Bitmap Index Scan', 'Shared Hit Blocks')::int
> > + lab.field(p, 'Bitmap Index Scan', 'Shared Read Blocks')::int < 50
> > and lab.field(p, 'Bitmap Heap Scan', 'Exact Heap Blocks')::int between 23500 and 24300
> > from lab.plan($$ select * from events where project_id between 4000 and 4400 $$) p));
> > ```
> >
> > [Full lab script](https://www.flagon.io/books/eight-kilobytes/lab/16-btree.sql)
### The best heap page is the one you never read
Counting project 4242's events needs nothing the index doesn't hold, so the heap stays closed:
```text
Aggregate ...
Buffers: shared hit=5
-> Index Only Scan using events_project_id_idx on events ... rows=85.00 ...
Heap Fetches: 0
```
The same 85 rows that cost 91 pages to fetch, counted in 5 pages.
The catch: an index entry doesn't know whether its row is visible to you ([Updates are inserts](/en/06-mvcc/#basics-chapter-6)). So the scan checks the **visibility map**: one bit per heap page meaning "every row here is visible to everyone" ([Two bits per page let scans and vacuum skip work](/en/04-storage/#two-bits-per-page-let-scans-and-vacuum-skip-work)). Where the bit is clear, it fetches the row anyway. Vacuum sets the bits.
> [!TIP] Read Heap Fetches
>
> Whenever you see `Index Only Scan`, check `Heap Fetches`. Close to the rows returned means vacuum isn't keeping up, and the scan is quietly an ordinary one.
## Multicolumn indexes: order is the design
The dashboard doesn't ask "which rows belong to project 4242?" It asks "what are project 4242's twenty newest events?" Index the question, not the column.
The single-column index answers the first and leaves Postgres to sort: fine for 85 events, painful for 200,000. Give the index both columns:
```sql
create index events_project_created_idx on events (project_id, created_at);
```
```text
Limit ... (actual time=0.009..0.023 rows=20.00 loops=1)
Buffers: shared hit=23
-> Index Scan Backward using events_project_created_idx on events ...
```
No sort. The project's entries sit together in time order, so Postgres walks back from the newest and stops after 20: 3 index pages plus 20 heap pages, whether the project has 85 events or 85 million.
Cost proportional to rows returned, not rows stored. That's what you're designing for.
> [!EXAMPLE]- Prove it · lab `16-btree`
>
> ```sql
> create index events_project_created_idx on events (project_id, created_at);
>
> select lab.prove('35,249 pages to 23 is more than 1,000 times less work',
> 35249.0 / lab.warm_buffers($$ select * from events where project_id = 4242
> order by created_at desc limit 20 $$) > 1000);
> ```
>
> [Full lab script](https://www.flagon.io/books/eight-kilobytes/lab/16-btree.sql)
### Equality first, then range or sort
A phone book sorted by last name, then first name, finds "the Smiths, A to C" in one stretch. "Everyone named Alice" means reading the whole book.
Here is "this project, last 30 days" on `(created_at, project_id)`, then on `(project_id, created_at)`:
```text
Index Scan using events_created_project_idx on events ... rows=11.00 ...
Buffers: shared hit=643
```
```text
Index Scan using events_project_created_idx on events ... rows=11.00 ...
Buffers: shared hit=14
```
Same 11 rows, 45 times the pages. With `created_at` first, Postgres reads every entry from the last 30 days and checks the project on each.
> [!DETAILS]- Deep dive: Why the wrong order looks right in the plan
>
> Both plans list both columns under `Index Cond`, which is why this mistake survives code review. What differs is which condition bounds the scan. With `(created_at, project_id)`, only `created_at >= '2026-09-06'` decides where the scan starts and stops, so it reads all of the last 30 days, about 164,000 entries, testing `project_id` on each. The dashboard query did worse on that index: 1,399 pages, walking the whole time range backward hunting for project 4242. (The sample data ends on 2026-10-06, so the date is written out; in your app it's `now() - interval '30 days'`.)
>
> > [!EXAMPLE]- Prove it · lab `16-btree`
> >
> > ```sql
> > -- Leave only the wrong-order index, so the planner has to use it.
> > begin;
> > drop index events_project_created_idx;
> > drop index events_project_id_idx;
> > select lab.prove('with (created_at, project_id), "this project, last 30 days" reads about 643 pages',
> > lab.warm_buffers($$ select * from events where project_id = 4242
> > and created_at >= '2026-09-06' $$) between 500 and 800);
> > select lab.prove('and the dashboard query reads about 1,399 pages walking the time range backward',
> > lab.warm_buffers($$ select * from events where project_id = 4242
> > order by created_at desc limit 20 $$) between 1200 and 1600);
> > rollback;
> > ```
> >
> > [Full lab script](https://www.flagon.io/books/eight-kilobytes/lab/16-btree.sql)
The rule fits on a sticky note:
1. Columns compared with `=` (or `in`) go first.
2. Then at most one column used for a range or for `order by`.
3. Anything after that gets checked, but doesn't narrow what's read.
Among equality columns, put first the one you also query alone: `(a, b)` serves `a` by itself too. PostgreSQL 18's **skip scan** can rescue an index whose first column the query skips, but only when that column has few values. Don't count on it.
> [!DETAILS]- Deep dive: When skip scan bails you out, and when it gives up
>
> Skip scan works when the leading column has only a few values: the B-tree does one descent per value. An index on `(kind, created_at)` counted the last day's events, a query that never mentions `kind`, in 44 pages instead of 35,173:
>
> ```text
> Buffers: shared hit=44
> -> Index Only Scan using events_kind_created_idx on events ... rows=5480.00 ...
> Index Cond: (created_at >= '2026-10-05 ...'::timestamp with time zone)
> Index Searches: 6
> ```
>
> `Index Searches` (new in PostgreSQL 18's EXPLAIN) counts descents from the root: 1 for a plain lookup, 6 here for five kinds: one per kind, plus one that runs off the end of the index. Nothing else in the plan says "skip".
>
> With thousands of leading values, the planner prices skip scan above a sequential scan. A lookup by email alone on the index behind the table's `unique (account_id, email)` would need 1,000 descents, one per account, so it still read the whole table.
>
> > [!EXAMPLE]- Prove it · lab `16-btree`
> >
> > ```sql
> > select lab.prove('with 6 index searches for the 5 kinds',
> > (select lab.field(p, 'Index Only Scan', 'Index Searches')::int = 6
> > from lab.plan($$ select count(*) from events where created_at >= '2026-10-05' $$) p));
> >
> > select lab.prove('a lookup by email alone does not skip-scan users (account_id, email): 1,000 accounts is too many',
> > 'Seq Scan' = any(lab.nodes($$ select id from users where email = 'user4242@example.com' $$)));
> > ```
> >
> > [Full lab script](https://www.flagon.io/books/eight-kilobytes/lab/16-btree.sql)
## Covering indexes: cover the hot query, not every query
Say the dashboard shows only `created_at` and `kind`. The 50 newest still cost 53 pages, nearly all heap pages fetched to read `kind`. Carry it in the index as a passenger:
```sql
drop index events_project_created_idx;
create index events_project_created_idx
on events (project_id, created_at) include (kind);
```
Now it's an `Index Only Scan` reading 6 pages. `INCLUDE` (PostgreSQL 11+) stores extra columns only in the leaves. The price: the index grew from 60 MB to 77 MB, and every insert writes those bytes. Cover the two or three queries that run thousands of times a second. Nothing else. Because `INCLUDE` columns sit outside uniqueness, it's also the only way to add columns to a unique index without changing what "unique" means.
> [!DETAILS]- Deep dive: What a covering index costs when vacuum falls behind
>
> Update the project's 85 rows, which clears the all-visible bits on their pages, then run the 50-row query before and after `vacuum events`. Only these lines differ:
>
> ```text
> Buffers: shared hit=180
> Heap Fetches: 99
> ```
>
> ```text
> Buffers: shared hit=5
> Heap Fetches: 0
> ```
>
> Same plan, 180 pages against 5. There are more heap fetches (99) than rows returned (50) because the update left a dead index entry beside each new one, and the scan has to visit the heap to learn which of the two is visible. On an append-only table autovacuum rarely visits (common before PostgreSQL 13 added insert-triggered autovacuum), `Heap Fetches` creeps up to the row count and the covering index quietly stops covering. InnoDB plays by different rules ([Covering indexes come for free in InnoDB, almost](/en/11-not-mysql/#covering-indexes-come-for-free-in-innodb-almost)).
>
> > [!EXAMPLE]- Prove it · lab `16-btree`
> >
> > ```sql
> > update events set payload = payload || '{"seen": true}' where project_id = 4242;
> >
> > create temp table ios as
> > select lab.plan($$ select created_at, kind from events where project_id = 4242
> > order by created_at desc limit 50 $$) as p;
> >
> > select lab.prove('after updating the project''s 85 rows, the first index-only scan fetches heap tuples (about 99)',
> > (select lab.field(p, 'Index Only Scan', 'Heap Fetches')::int between 50 and 120 from ios));
> >
> > vacuum events;
> >
> > select lab.prove('and the same plan reads 5 pages',
> > lab.warm_buffers($$ select created_at, kind from events where project_id = 4242
> > order by created_at desc limit 50 $$) <= 6);
> > ```
> >
> > [Full lab script](https://www.flagon.io/books/eight-kilobytes/lab/16-btree.sql)
## Index the rows you ask about, not the whole table
The on-call page wants a slice of the table, not all of it. It lists recent failed deploys, about 6% of events, and reads the whole table to do it. A **partial index** holds only the rows matching its `where` clause:
```sql
create index events_failed_deploys_idx on events (created_at)
where kind = 'deploy' and payload->>'status' = 'failed';
```
Now it reads 11 pages. At 2,768 KB, against 43 MB for `(created_at)` on every row, it stays in cache, and inserts that don't match never touch it. Queues and soft deletes are the classic uses.
One trap: the planner must prove at plan time that your `where` implies the index's. **Write the predicate's constants as literals.** If your ORM makes them parameters, a [generic plan](/en/43-glossary/#generic-plan) can ignore the index.
> [!DETAILS]- Deep dive: Why a prepared statement can ignore a partial index
>
> A **generic plan**, built once for any parameter value, can't know what `$1` will be ([Prepared statements switch plans after five runs](/en/20-planner/#prepared-statements-switch-plans-after-five-runs)). With the 43 MB `(created_at)` index also in place:
>
> ```sql
> set plan_cache_mode = force_generic_plan;
> prepare q(text) as
> select id from events
> where kind = 'deploy' and payload->>'status' = $1
> order by created_at desc limit 20;
> explain (costs off) execute q('failed');
> ```
>
> ```text
> Limit
> -> Index Scan Backward using events_created_at_idx on events
> Filter: ((kind = 'deploy'::text) AND ((payload ->> 'status'::text) = $1))
> ```
>
> The partial index is ignored; the plan walks the full index and filters. Use `force_generic_plan` in a test to see what your query's sixth execution will do. A partial **unique** index is how "email is unique among non-deleted users" works ([A soft delete needs a partial unique index](/en/14-relationships/#a-soft-delete-needs-a-partial-unique-index)).
>
> > [!EXAMPLE]- Prove it · lab `16-btree`
> >
> > ```sql
> > select lab.prove('(created_at) on all rows is 43 MB; the partial one 2,768 kB',
> > pg_size_pretty(pg_relation_size('events_created_at_idx')) = '43 MB'
> > and pg_size_pretty(pg_relation_size('events_failed_deploys_idx')) = '2768 kB');
> > ```
> >
> > [Full lab script](https://www.flagon.io/books/eight-kilobytes/lab/16-btree.sql)
## An index stores exactly what you gave it
An index holds the values you indexed, not what a function makes of them. Wrap the column in a function and the index can't see you: `where lower(email) = 'user4242@example.com'` read all 1,126 pages of `users`. Index the expression:
```sql
create index users_lower_email_idx on users (lower(email));
```
Now it reads 4 pages. The query must use the same expression, written the same way; run `analyze users` afterward so the planner has statistics on it.
Make it unique and it enforces what a plain constraint can't:
```sql
create unique index users_lower_email_key on users (lower(email));
```
Now `USER4242@example.com` is rejected as a duplicate of `user4242@example.com`. A unique index already answers queries, so never add a second, non-unique one on the same columns "for performance".
> [!DETAILS]- Deep dive: Why created_at::date can't be indexed, and what to write instead
>
> Index expressions accept only `immutable` functions: same input, same output, forever. Casting a `timestamptz` to `date` isn't, because the day a moment falls on depends on the session's time zone, and Postgres refuses with `functions in index expression must be marked IMMUTABLE`. Spell out the zone and it works: `((created_at at time zone 'UTC')::date)`. Never wrap the cast in your own function labeled `immutable` to get past the check: the index stores days computed in the zone of whichever session wrote each row, and a query from another zone misses rows.
>
> For plain columns, prefer a `unique` table constraint to a unique index: it shows in `\d`, can be deferrable, and `on conflict on constraint` can name it. Use the index form for expressions and `where` clauses.
>
> > [!EXAMPLE]- Prove it · lab `16-btree`
> >
> > ```sql
> > select lab.prove('USER4242@example.com is rejected: duplicate key value violates unique constraint "users_lower_email_key"',
> > (select state = '23505'
> > and msg = 'duplicate key value violates unique constraint "users_lower_email_key"'
> > from caught where k = 'unique'));
> >
> > select lab.prove('created_at::date on a timestamptz cannot be indexed: functions in index expression must be marked IMMUTABLE',
> > (select state = '42P17' and msg = 'functions in index expression must be marked IMMUTABLE'
> > from caught where k = 'immutable'));
> > ```
> >
> > [Full lab script](https://www.flagon.io/books/eight-kilobytes/lab/16-btree.sql)
## Deduplication: repeated keys are stored once (PostgreSQL 13+)
The index on `project_id` is 14 MB. The primary key, also a bigint over the same rows, is 43 MB. The difference is **deduplication**: Postgres stores a repeated key once, followed by the list of rows that have it, which shrinks indexes on foreign keys and statuses to about a third of their size.
Smaller doesn't mean useful. Each of the five values of `kind` matches at least an eighth of the table, so its rows sit on nearly every page, and an index on `kind` alone read more pages for `kind = 'alert'` than a sequential scan. A column with a handful of values belongs inside a multicolumn or partial index, never alone.
> [!DETAILS]- Deep dive: Inside a posting list, and which types can't deduplicate
>
> Rebuild the `project_id` index `with (deduplicate_items = off)` and it's 43 MB, like the primary key. Inside the leaves:
>
> ```text
> index | avg_items | avg_item_bytes
> ---------------------------+-----------+----------------
> events_project_id_idx | 13 | 571
> events_project_id_nodedup | 367 | 16
> ```
>
> Thirteen fat **posting lists** hold what took 367 plain entries. (The `kind` index dedupes to 13 MB, but the `kind = 'alert'` bitmap scan still visited 35,154 of the table's 35,173 pages plus 213 index pages.)
>
> Deduplication is off wherever equal values can differ in bytes: `numeric`, `jsonb`, `float4` and `float8`, arrays and other container types, and text with a nondeterministic collation. It's also off for any index with `INCLUDE` columns, part of why the covering index grew. `allequalimage` in `bt_metap` says whether an index qualifies; indexes carried over from PostgreSQL 12 or earlier by `pg_upgrade` need a `reindex` to get it.
>
> > [!EXAMPLE]- Prove it · lab `16-btree`
> >
> > ```sql
> > select lab.prove('deduplication makes low-cardinality indexes about three times smaller',
> > pg_relation_size('events_project_id_nodedup')::numeric / pg_relation_size('events_project_id_idx') between 2.8 and 3.4
> > and pg_relation_size('events_kind_nodedup')::numeric / pg_relation_size('events_kind_idx') between 2.8 and 3.6);
> >
> > select lab.prove('so it reads more pages than a sequential scan would',
> > lab.buffers($$ select * from events where kind = 'alert' $$) > 35173);
> > ```
> >
> > [Full lab script](https://www.flagon.io/books/eight-kilobytes/lab/16-btree.sql)
## Every index is a tax on writes
Every index makes some read faster and every write slower, forever. We inserted the same 200,000 events three times, adding indexes each time:
| Indexes on the table | Buffer accesses | WAL written |
|---|---|---|
| none | 211,120 | 32 MB |
| primary key | 561,333 | 45 MB |
| primary key + 4 secondary | 2,363,118 | 106 MB |
**Table 17-1.** Every index is a tax on writes
Four ordinary secondary indexes made the same insert touch about four times the buffers and more than double its WAL ([Write it down first](/en/08-wal/#basics-chapter-8)).
Updates pay too: one that changes no indexed column and fits on its page is **HOT** and skips every index, and any other adds an entry to all of them ([A cold update pays for every index](/en/07-hot/#a-cold-update-pays-for-every-index)).
> [!NOTE] Indexes are not free
>
> You pay for every index on every insert, every non-HOT update, every vacuum, and in cache, WAL, replicas, and backups. Add one for a query you can name, measure before and after, and drop what nothing uses.
> [!DETAILS]- Deep dive: How we measured the insert tax
>
> Each run is the same insert under `explain (analyze, buffers, wal)`; between runs, `truncate events_w` and add indexes:
>
> ```sql
> create table events_w (like events including defaults);
> explain (analyze, buffers, wal, costs off)
> insert into events_w select * from events where id <= 200000;
> -- run 2: alter table events_w add primary key (id);
> -- run 3: plus (project_id, created_at), (account_id, created_at),
> -- (user_id), (created_at)
> ```
>
> Each index entry is its own descent, its own dirty page, its own WAL record. WAL varies by a few MB between runs, depending on whether a checkpoint lands mid-insert and forces full-page images; the buffer counts don't. Random keys like UUIDv4 make the tax worse, because every insert lands on a different leaf ([Increasing keys append; random keys land anywhere](/en/13-keys/#increasing-keys-append-random-keys-land-anywhere)).
>
> > [!EXAMPLE]- Prove it · lab `16-btree`
> >
> > ```sql
> > -- tax holds (k, buffers, wal) from lab.plan() of each insert
> > select lab.prove('four secondary indexes made the insert touch about four times as many buffers',
> > (select a.buffers::numeric / b.buffers between 3.5 and 5 from tax a, tax b where a.k = 'pk+4' and b.k = 'pk'));
> >
> > select lab.prove('and more than doubled its WAL',
> > (select a.wal / b.wal > 2 from tax a, tax b where a.k = 'pk+4' and b.k = 'pk'));
> > ```
> >
> > [Full lab script](https://www.flagon.io/books/eight-kilobytes/lab/16-btree.sql)
## An idx_scan of zero is a suspect, not a verdict
An index takes one line to add, and nobody ever removes one. `pg_stat_user_indexes` counts scans of every index, so an `idx_scan` of zero is a suspect. Before you drop one:
- **Check how long the counters have run** (`stats_reset` in `pg_stat_database`). The month-end report's index looks unused for 29 days. On PostgreSQL 16+, `last_idx_scan` says when each index was last used, which is easier to reason about than a reset date.
- **Check every replica.** Counters are per server; an index idle on the primary may carry every replica.
- **Leave unique and primary key indexes alone.** They enforce constraints.
- **Drop with `drop index concurrently`** ([Change the schema, keep the site](/en/26-migrations/#basics-chapter-26)), and keep the `create index` handy.
Duplicates need less judgment. Someone adds `(project_id)` for a foreign key, someone later adds `(project_id, created_at)` for the dashboard, and the first now only costs writes: the longer index serves every lookup the shorter one did.
> [!DETAILS]- Deep dive: Two queries that find indexes to drop
>
> Unused indexes, biggest first:
>
> ```sql
> select s.relname as table_name, s.indexrelname as index_name, s.idx_scan,
> pg_size_pretty(pg_relation_size(s.indexrelid)) as size
> from pg_stat_user_indexes s
> join pg_index i on i.indexrelid = s.indexrelid
> where s.idx_scan = 0 and not i.indisunique and not i.indisprimary
> order by pg_relation_size(s.indexrelid) desc;
> ```
>
> ```text
> table_name | index_name | idx_scan | size
> ------------+------------------------+----------+-------
> events | events_created_at_idx | 0 | 43 MB
> events | events_project_id_idx2 | 0 | 14 MB
> ```
>
> The second row is a copy of the `project_id` index we planted. The first is the `(created_at)` index from the partial-index comparison: we only ever ran `explain` on it without `analyze`, which doesn't execute the query, so it never counted as a scan.
>
> Indexes whose key columns are a prefix of another's:
>
> ```sql
> select a.indrelid::regclass as table_name,
> a.indexrelid::regclass as redundant,
> b.indexrelid::regclass as covered_by
> from pg_index a
> join pg_index b
> on b.indrelid = a.indrelid
> and b.indexrelid <> a.indexrelid
> and b.indnkeyatts >= a.indnkeyatts
> and (b.indkey::text || ' ') like (a.indkey::text || ' %')
> where not a.indisunique
> and a.indnatts = a.indnkeyatts
> and a.indpred is null and b.indpred is null
> and a.indexprs is null and b.indexprs is null
> and (a.indkey::text <> b.indkey::text or a.indexrelid > b.indexrelid)
> order by 2, 3;
> ```
>
> ```text
> table_name | redundant | covered_by
> ------------+------------------------+----------------------------
> events | events_project_id_idx | events_project_created_idx
> events | events_project_id_idx2 | events_project_id_idx
> events | events_project_id_idx2 | events_project_created_idx
> ```
>
> It compares column numbers only (no operator classes, collations, or sort direction) and skips partial and expression indexes, so read each hit before acting.
>
> > [!EXAMPLE]- Prove it · lab `16-btree`
> >
> > ```sql
> > select lab.prove('events_created_at_idx shows up too: EXPLAIN without ANALYZE never counts as a scan',
> > (select idx_scan = 0 from pg_stat_user_indexes where indexrelname = 'events_created_at_idx'));
> > ```
> >
> > [Full lab script](https://www.flagon.io/books/eight-kilobytes/lab/16-btree.sql)
## Design an index from a query, not a column
1. **Start from a query, not a column.** Get the real SQL from `pg_stat_statements` ([Start with pg_stat_statements](/en/31-observability/#start-with-pg_stat_statements)) and write down the pages its plan touches.
2. **Put equality columns first**, then one range or `order by` column, and let the index do the sorting.
3. **Consider a partial index** for a fixed subset, and `INCLUDE` only for a very hot query.
4. **Look for an existing index** this one makes redundant.
5. **Build it with `create index concurrently`** ([Pick the index build that matches the table's traffic](/en/26-migrations/#pick-the-index-build-that-matches-the-tables-traffic)) and compare pages. No drop of an order of magnitude? Find out why before you keep it.
## The short version
- A lookup costs the tree's depth (3 or 4 pages) plus one heap page per matching row.
- Index the question: equality columns first, then one range or sort column. The wrong order turned 14 pages into 643.
- Index-only scans need a current visibility map. Watch `Heap Fetches`.
- Partial indexes are small and cheap; write their predicate as literals.
- Never index a column with a handful of values on its own.
- Every index taxes every write: four extra made an insert touch four times the buffers.
- Audit `idx_scan = 0` over a long window, on every replica.
## Further reading
- [Indexes](https://www.postgresql.org/docs/18/indexes.html), PostgreSQL documentation. The official chapter, including multicolumn, index-only, partial, and expression indexes.
- [B-Tree Indexes: implementation](https://www.postgresql.org/docs/18/btree.html#BTREE-IMPLEMENTATION), PostgreSQL documentation. Structure, deduplication, and bottom-up deletion.
- [src/backend/access/nbtree/README](https://github.com/postgres/postgres/blob/master/src/backend/access/nbtree/README), PostgreSQL source. Right-links, high keys, and page deletion from the people who wrote them.
- [Efficient Locking for Concurrent Operations on B-Trees](https://www.csd.uoc.gr/~hy460/pdf/p650-lehman.pdf), Philip L. Lehman and S. Bing Yao, ACM TODS, 1981. The B-link tree behind Postgres's sibling links.
- [PostgreSQL 18 release notes](https://www.postgresql.org/docs/18/release-18.html), PostgreSQL. Skip scan and the new `Index Searches` line.
- [Anatomy of an SQL Index](https://use-the-index-luke.com/sql/anatomy), Markus Winand. The clearest mental model of leaf chains and tree depth.