# B-树挑起大梁
> 了解 B-树如何通过三四次页读取找到一行,如何排列索引列,以及如何识别那些代价超过收益的索引。
---
LLMS 索引: [llms.txt](/llms.txt)
---
大多数慢查询并没有做什么难事。它们只是每次都读取整张表去找少数几行,因为没人告诉 Postgres 应该去哪里找。
这是每当有人打开项目页面时都会运行的一条查询:
```sql
explain (analyze, buffers)
select * from events
where project_id = 4242
order by created_at desc
limit 20;
```
```text
Limit ... (actual time=24.828..25.941 rows=20.00 loops=1)
Buffers: shared hit=358 read=34891
...
-> Parallel Seq Scan on events ...
Rows Removed by Filter: 666638
```
它读取了 35,249 个页才返回 20 行:每次打开页面时,都要读取这张表的 35,173 个页中的每一个(`events` 整整 275 MB),再加上规划和排序所需的几十个页。在我们的笔记本上,表已经在内存中,所以只花了 26 ms,这就是没人注意到它的原因。在缓存是冷的生产机器上,如果同时有 50 个人打开仪表板,这条查询就能让整个数据库停摆。
> [!EXAMPLE]- 动手验证 · lab `16-btree`
>
> ```sql
> select lab.prove('with no index, the dashboard query reads the whole table (about 35,249 pages)',
> lab.buffers($$ select * from events where project_id = 4242
> order by created_at desc limit 20 $$) between 35173 and 35400);
> ```
>
> [完整实验脚本](https://www.flagon.io/books/eight-kilobytes/lab/16-btree.sql)
运行正确的 `create index` 之后,它只读取 23 个页。这是你能买到的最便宜的加速方式,而本章讲的是如何有目的地购买这种收益,同时拒绝那些只会增加成本的索引。在每个计划中,都要看 `Buffers:` 这一行,它统计的是 8 KB 页。页是证据;毫秒只是天气([Buffers 才是证据](/19-explain/#buffers-are-the-evidence))。
## B-树是一棵由页组成的浅树 {#a-b-tree-is-a-shallow-tree-of-pages}
想象一个图书馆的卡片目录:柜子上的标牌告诉你该找哪个抽屉,标签告诉你该找哪张卡片,卡片再告诉你书架在哪里。你不需要读完整个目录。B-树(B-tree)就是用 8 KB 页构成的这类目录,而书架就是**堆(heap)**:也就是表本身,一堆无序的页([一切都从页说起](/04-storage/#basics-chapter-4))。下面是 `events` 的主键:
**图 17-1.** 查找每一层读取一个页,然后读取堆。events 的主键有 1 个根页、19 个内部页和 5\,465 个叶页,堆共有 35\,173 个页,因此查找一行会读取树中的三个页和堆中的一个页。
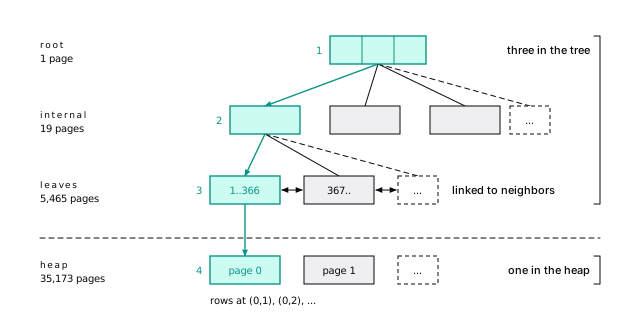
**叶页**按顺序保存每个键,每个键都带有一个**元组标识符(TID)**,也就是该行在堆中的 `(page, item)` 地址(它的 [ctid](/04-storage/#a-line-pointer-lets-a-tuple-move-without-changing-its-address)),并且还链接到相邻叶页,让范围扫描可以横向遍历。上面的页只负责说明下一步该访问哪个子节点。
关键就在这棵树的形状。每个内部页大约指向 300 个子节点,因此三层可以容纳约 3,000 万个键,四层可以容纳约 100 亿个键。让表扩大到原来的 300 倍,查找也只多读取一个页。在 [查询就是页和往返](/03-latency/#a-query-is-pages-and-round-trips)中,一个主键查找读取了四个页:树中三个,堆中一个。记住这一点:
**一次索引查找的成本,是树的深度加上每个匹配行对应的一个堆页。**
查找在树上花费的只有三四个页,而且这个开销几乎不会增长。真正花钱的是堆页,本章剩下的内容都在讲如何少读一些堆页。
> [!NOTE] 从 MySQL 过来
>
> Postgres 没有聚簇索引:每个索引,包括主键在内,都指向无序堆中的位置([在 InnoDB 中,表就是主键](/11-not-mysql/#the-table-is-the-primary-key-in-innodb))。
> [!DETAILS]- 深入阅读:pageinspect 如何展示主键内部
>
> 每棵 B-树的 0 号块都是记录根位置的**元页面(metapage)**。`pageinspect` 会读取它,并汇总每个页(`bt_multi_page_stats` 在 PostgreSQL 16+ 中可用):
>
> ```sql
> select root, level from bt_metap('events_pkey');
>
> select type, count(*) as pages, round(avg(live_items)) as avg_items
> from bt_multi_page_stats('events_pkey', 1, -1)
> group by type;
> ```
>
> ```text
> root | level
> ------+-------
> 412 | 2
>
> type | pages | avg_items
> ------+-------+-----------
> r | 1 | 19
> i | 19 | 289
> l | 5465 | 367
> ```
>
> 根位于 412 号块,层级为 2:整棵树有三层。19 个内部页各自指向大约 289 个叶页,5,465 个叶页各自存放约 367 个 16 字节条目(一个 8 字节键,加上一个携带 TID 的 8 字节头部)。每个叶页有一个槽位是**高键(high key)**,也就是该页的上界(第一个叶页的高键是 367,即下一个叶页的第一个 ID),因此 5,465 个每页 366 行的叶页就是两百万行。
>
> > [!EXAMPLE]- 动手验证 · lab `16-btree`
> >
> > ```sql
> > select lab.prove('5,465 leaves holding about 367 entries of 16 bytes',
> > (select count(*) = 5465 and round(avg(live_items)) = 367 and round(avg(avg_item_size)) = 16
> > from bt_multi_page_stats('events_pkey', 1, -1) where type = 'l'));
> > ```
> >
> > [完整实验脚本](https://www.flagon.io/books/eight-kilobytes/lab/16-btree.sql)
## 第一个索引:35,249 页降到 91 页 {#the-first-index-35249-pages-to-91}
先从最直观的索引开始,在 `where` 使用的列上建立索引:
```sql
create index events_project_id_idx on events (project_id);
```
```text
Limit ... (actual time=0.107..0.109 rows=20.00 loops=1)
Buffers: shared hit=91
-> Sort ...
-> Bitmap Heap Scan on events ... rows=85.00 ...
Heap Blocks: exact=85
-> Bitmap Index Scan on events_project_id_idx ...
Buffers: shared hit=3
```
从 35,249 个页降到 91 个页。自下而上读:
- **索引:**读取 3 个页,找到这个项目的全部 85 行。
- **堆:**读取 85 个页,每行一个(`Heap Blocks: exact=85`)。这些事件在一年中随机到达,因此每一行都落在了不同的页上。
- **排序:**保留最新的 20 行。
读取 3 个页来查找,再读取 85 个页来取数据。这个比例很正常。
> [!EXAMPLE]- 动手验证 · lab `16-btree`
>
> ```sql
> create index events_project_id_idx on events (project_id);
>
> select lab.prove('the dashboard query now reads about 91 pages',
> lab.warm_buffers($$ select * from events where project_id = 4242
> order by created_at desc limit 20 $$) between 85 and 100);
> ```
>
> [完整实验脚本](https://www.flagon.io/books/eight-kilobytes/lab/16-btree.sql)
## 索引能帮多少忙,取决于匹配行有多集中 {#an-index-helps-only-as-much-as-its-rows-sit-together}
在索引中找到行很便宜。从堆中取出它们才是账单,而 Postgres 有三种方式来支付这笔账。**索引扫描(Index Scan)**会在遍历索引时逐行取出数据,因此行会按顺序返回;上面计划中的**位图扫描(bitmap scan)**会先收集所有匹配项,再按物理顺序每个堆页访问一次;**仅索引扫描(index-only scan)**则完全跳过堆。
这里有个不太舒服的事实:**匹配行在堆中越集中,索引就越有帮助。** 按项目范围请求 `events` 的 2% 行时,这些行分散在 68% 的页上。超过某个点后,按顺序读取整张表反而更便宜,规划器就会切换到顺序扫描。这不是规划器犯傻,而是规划器在数页。
> [!DETAILS]- 深入阅读:为什么查询 2% 的行却要读取表中 68% 的页
>
> 从项目范围中取出约 40,000 行:
>
> ```sql
> explain (analyze, buffers)
> select * from events where project_id between 4000 and 4400;
> ```
>
> ```text
> Bitmap Heap Scan on events ... (actual time=4.074..83.678 rows=39827.00 loops=1)
> Recheck Cond: ((project_id >= 4000) AND (project_id <= 4400))
> Heap Blocks: exact=23913
> -> Bitmap Index Scan on events_project_id_idx ...
> Buffers: shared hit=3 read=34
> ```
>
> 索引只花了 37 个页;堆花了 23,913 个页。`Recheck Cond` 表示堆扫描会重新检查每一行。如果位图超过 `work_mem`(一次操作可以使用的内存),它就会变成**有损(lossy)**,只记住整页而不是具体行(`Heap Blocks: exact=... lossy=...`),然后重新检查这些页中的每一行。
>
> > [!EXAMPLE]- 动手验证 · lab `16-btree`
> >
> > ```sql
> > select lab.prove('the index part costs under 50 pages, the heap part about 23,913 pages (68% of the table)',
> > (select lab.field(p, 'Bitmap Index Scan', 'Shared Hit Blocks')::int
> > + lab.field(p, 'Bitmap Index Scan', 'Shared Read Blocks')::int < 50
> > and lab.field(p, 'Bitmap Heap Scan', 'Exact Heap Blocks')::int between 23500 and 24300
> > from lab.plan($$ select * from events where project_id between 4000 and 4400 $$) p));
> > ```
> >
> > [完整实验脚本](https://www.flagon.io/books/eight-kilobytes/lab/16-btree.sql)
### 最好的堆页,是你永远不会读到的 {#the-best-heap-page-is-the-one-you-never-read}
统计项目 4242 的事件不需要索引之外的任何信息,因此堆可以完全不打开:
```text
Aggregate ...
Buffers: shared hit=5
-> Index Only Scan using events_project_id_idx on events ... rows=85.00 ...
Heap Fetches: 0
```
取出同样的 85 行要付出 91 个页的代价,现在只需 5 个页就能完成计数。
问题在于:索引项不知道它指向的行对你是否可见([更新就是插入](/06-mvcc/#basics-chapter-6))。因此,扫描会检查**可见性映射(visibility map)**:堆中的每个页都有一位,用来表示“这里的每一行对所有人都可见”([每页两位让扫描和清理跳过工作](/04-storage/#two-bits-per-page-let-scans-and-vacuum-skip-work))。如果这一位没有设置,它仍会读取该行。清理会设置这些位。
> [!TIP] 读懂 Heap Fetches
>
> 每当看到 `Index Only Scan`,都要检查 `Heap Fetches`。如果它接近返回的行数,说明清理没有跟上,扫描正悄悄变成普通索引扫描。
## 多列索引:顺序就是设计 {#multicolumn-indexes-order-is-the-design}
仪表板问的不是“哪些行属于项目 4242?”,而是“项目 4242 最新的 20 个事件是什么?”要为问题建索引,而不是为列建索引。
单列索引能回答第一个问题,却要把排序交给 Postgres:对 85 个事件来说没问题,面对 200,000 个事件就很痛苦。把两列都交给索引:
```sql
create index events_project_created_idx on events (project_id, created_at);
```
```text
Limit ... (actual time=0.009..0.023 rows=20.00 loops=1)
Buffers: shared hit=23
-> Index Scan Backward using events_project_created_idx on events ...
```
不需要排序。这个项目的条目按时间顺序相邻排列,所以 Postgres 从最新的条目向回走,找到 20 行就停下:3 个索引页加 20 个堆页;无论这个项目有 85 个事件还是 8,500 万个事件,代价都一样。
代价与返回的行数成正比,而不是与存储的行数成正比。这正是你要设计的目标。
> [!EXAMPLE]- 动手验证 · lab `16-btree`
>
> ```sql
> create index events_project_created_idx on events (project_id, created_at);
>
> select lab.prove('35,249 pages to 23 is more than 1,000 times less work',
> 35249.0 / lab.warm_buffers($$ select * from events where project_id = 4242
> order by created_at desc limit 20 $$) > 1000);
> ```
>
> [完整实验脚本](https://www.flagon.io/books/eight-kilobytes/lab/16-btree.sql)
### 先等值,再范围或排序 {#equality-first-then-range-or-sort}
按姓、名排序的电话簿,可以连续找到“姓 Smith、名从 A 到 C”的人。“所有名叫 Alice 的人”则意味着要读完整本电话簿。
下面分别是在 `(created_at, project_id)` 和 `(project_id, created_at)` 上查询“这个项目,最近 30 天”的结果:
```text
Index Scan using events_created_project_idx on events ... rows=11.00 ...
Buffers: shared hit=643
```
```text
Index Scan using events_project_created_idx on events ... rows=11.00 ...
Buffers: shared hit=14
```
同样是 11 行,前者读取的页数却是后者的 45 倍。把 `created_at` 放在第一列时,Postgres 会读取最近 30 天内的每一个条目,再逐个检查项目。
> [!DETAILS]- 深入阅读:为什么错误的顺序在计划中看起来没问题
>
> 两个计划都在 `Index Cond` 下列出两列,这就是这个错误能通过代码审查的原因。不同之处在于,究竟哪个条件限定了扫描范围。使用 `(created_at, project_id)` 时,只有 `created_at >= '2026-09-06'` 决定扫描从哪里开始、在哪里停止,所以它会读取最近 30 天的全部条目,约 164,000 个,再逐个检查 `project_id`。仪表板查询在这个索引上的表现更差:它反向遍历整个时间范围,寻找项目 4242,读取了 1,399 个页。(示例数据截至 2026-10-06,因此这里把日期直接写出来;在你的应用中,它会是 `now() - interval '30 days'`。)
>
> > [!EXAMPLE]- 动手验证 · lab `16-btree`
> >
> > ```sql
> > -- Leave only the wrong-order index, so the planner has to use it.
> > begin;
> > drop index events_project_created_idx;
> > drop index events_project_id_idx;
> > select lab.prove('with (created_at, project_id), "this project, last 30 days" reads about 643 pages',
> > lab.warm_buffers($$ select * from events where project_id = 4242
> > and created_at >= '2026-09-06' $$) between 500 and 800);
> > select lab.prove('and the dashboard query reads about 1,399 pages walking the time range backward',
> > lab.warm_buffers($$ select * from events where project_id = 4242
> > order by created_at desc limit 20 $$) between 1200 and 1600);
> > rollback;
> > ```
> >
> > [完整实验脚本](https://www.flagon.io/books/eight-kilobytes/lab/16-btree.sql)
这条规则可以写在便签上:
1. 用 `=`(或 `in`)比较的列放在前面。
2. 然后最多放一列用于范围查询或 `order by`。
3. 再往后的列只会被检查,不会缩小读取范围。
在等值列中,把你还会单独查询的那一列放在前面:`(a, b)` 也能单独服务于 `a`。PostgreSQL 18 的**跳跃扫描(skip scan)**可以挽救一个查询跳过第一列的索引,但只有在第一列的不同取值很少时才行。不要把希望寄托在它身上。
> [!DETAILS]- 深入阅读:跳跃扫描何时能救场,何时会放弃
>
> 第一列只有少数几种不同取值时,跳跃扫描才有效:B-树会针对每个值各下行一次。一个 `(kind, created_at)` 索引统计最近一天的事件,而查询完全没有提到 `kind`,只读取了 44 个页,而不是 35,173 个:
>
> ```text
> Buffers: shared hit=44
> -> Index Only Scan using events_kind_created_idx on events ... rows=5480.00 ...
> Index Cond: (created_at >= '2026-10-05 ...'::timestamp with time zone)
> Index Searches: 6
> ```
>
> `Index Searches`(PostgreSQL 18 的 EXPLAIN 新增)统计从根页下行的次数:普通查找为 1,这里五种事件类型是 6 次——每种类型一次,再加上一次越过索引末端。计划中的其他地方不会写出“skip”。
>
> 第一列有几千个值时,规划器会认为跳跃扫描的代价高于顺序扫描。仅按 email 查询时,若使用表上 `unique (account_id, email)` 背后的索引,就需要下行 1,000 次,每个账户一次,因此实际仍然读取了整张表。
>
> > [!EXAMPLE]- 动手验证 · lab `16-btree`
> >
> > ```sql
> > select lab.prove('with 6 index searches for the 5 kinds',
> > (select lab.field(p, 'Index Only Scan', 'Index Searches')::int = 6
> > from lab.plan($$ select count(*) from events where created_at >= '2026-10-05' $$) p));
> >
> > select lab.prove('a lookup by email alone does not skip-scan users (account_id, email): 1,000 accounts is too many',
> > 'Seq Scan' = any(lab.nodes($$ select id from users where email = 'user4242@example.com' $$)));
> > ```
> >
> > [完整实验脚本](https://www.flagon.io/books/eight-kilobytes/lab/16-btree.sql)
## 覆盖索引:覆盖热点查询,而不是每个查询 {#covering-indexes-cover-the-hot-query-not-every-query}
假设仪表板只显示 `created_at` 和 `kind`。最新的 50 行仍然要付出 53 个页的代价,其中几乎全是为了读取 `kind` 而访问的堆页。把它作为附带列放进索引:
```sql
drop index events_project_created_idx;
create index events_project_created_idx
on events (project_id, created_at) include (kind);
```
现在它是一个 `Index Only Scan`,只读取 6 个页。`INCLUDE`(PostgreSQL 11+)只把额外列存储在叶页中。代价是:索引从 60 MB 增长到 77 MB,每次插入都要写入这些字节。只覆盖每秒运行数千次的两三个查询,其他的都不要覆盖。因为 `INCLUDE` 列不参与唯一性判断,所以它也是在不改变“唯一”的含义时,给唯一索引增加列的唯一方式。
> [!DETAILS]- 深入阅读:清理落后时覆盖索引要付出什么代价
>
> 更新项目的 85 行,这会清除这些行所在页的全可见位,然后在 `vacuum events` 前后分别运行这个 50 行查询。只有下面几行不同:
>
> ```text
> Buffers: shared hit=180
> Heap Fetches: 99
> ```
>
> ```text
> Buffers: shared hit=5
> Heap Fetches: 0
> ```
>
> 计划相同,却是 180 个页对 5 个页。从堆取行的次数(99)比返回的行数(50)还多,因为这次更新在每个新索引项旁边留下了一个死索引项,扫描必须访问堆,才能知道两个版本中哪一个可见。对于 autovacuum 很少造访的只追加表(在 PostgreSQL 13 增加按插入触发的 autovacuum 之前很常见),`Heap Fetches` 会逐渐接近行数,覆盖索引也会悄悄失去覆盖能力。InnoDB 遵循不同的规则([在 InnoDB 中,覆盖索引几乎是免费得到的](/11-not-mysql/#covering-indexes-come-for-free-in-innodb-almost))。
>
> > [!EXAMPLE]- 动手验证 · lab `16-btree`
> >
> > ```sql
> > update events set payload = payload || '{"seen": true}' where project_id = 4242;
> >
> > create temp table ios as
> > select lab.plan($$ select created_at, kind from events where project_id = 4242
> > order by created_at desc limit 50 $$) as p;
> >
> > select lab.prove('after updating the project''s 85 rows, the first index-only scan fetches heap tuples (about 99)',
> > (select lab.field(p, 'Index Only Scan', 'Heap Fetches')::int between 50 and 120 from ios));
> >
> > vacuum events;
> >
> > select lab.prove('and the same plan reads 5 pages',
> > lab.warm_buffers($$ select created_at, kind from events where project_id = 4242
> > order by created_at desc limit 50 $$) <= 6);
> > ```
> >
> > [完整实验脚本](https://www.flagon.io/books/eight-kilobytes/lab/16-btree.sql)
## 只为要查询的行建索引,而不是整张表 {#index-the-rows-you-ask-about-not-the-whole-table}
值班页面只需要表中的一部分数据。它列出最近失败的部署,大约占事件的 6%,却要为此读取整张表。**部分索引(partial index)**只保存符合其 `where` 子句的行:
```sql
create index events_failed_deploys_idx on events (created_at)
where kind = 'deploy' and payload->>'status' = 'failed';
```
现在只需读取 11 个页。这个索引只有 2,768 KB,而覆盖所有行的 `(created_at)` 索引有 43 MB,因此它能常驻缓存,不符合条件的插入也完全不会触碰它。队列和软删除是典型用途。
有一个陷阱:规划器必须在规划时证明,你的 `where` 条件能推出索引的条件。**把谓词中的常量写成字面量。** 如果 ORM 把它们变成参数,[通用计划(generic plan)](/43-glossary/#generic-plan)就可能忽略这个索引。
> [!DETAILS]- 深入阅读:为什么预备语句可能忽略部分索引
>
> **通用计划**只生成一次,适用于任何参数值,因此无法知道 `$1` 会是什么([预备语句在运行五次后切换计划](/20-planner/#prepared-statements-switch-plans-after-five-runs))。如果还保留着那个 43 MB 的 `(created_at)` 索引:
>
> ```sql
> set plan_cache_mode = force_generic_plan;
> prepare q(text) as
> select id from events
> where kind = 'deploy' and payload->>'status' = $1
> order by created_at desc limit 20;
> explain (costs off) execute q('failed');
> ```
>
> ```text
> Limit
> -> Index Scan Backward using events_created_at_idx on events
> Filter: ((kind = 'deploy'::text) AND ((payload ->> 'status'::text) = $1))
> ```
>
> 部分索引被忽略了;计划沿着完整索引扫描,再过滤结果。在测试中使用 `force_generic_plan`,看看查询第六次执行时会怎么做。部分**唯一**索引可以实现“未删除用户的 email 必须唯一”([软删除需要部分唯一索引](/14-relationships/#a-soft-delete-needs-a-partial-unique-index))。
>
> > [!EXAMPLE]- 动手验证 · lab `16-btree`
> >
> > ```sql
> > select lab.prove('(created_at) on all rows is 43 MB; the partial one 2,768 kB',
> > pg_size_pretty(pg_relation_size('events_created_at_idx')) = '43 MB'
> > and pg_size_pretty(pg_relation_size('events_failed_deploys_idx')) = '2768 kB');
> > ```
> >
> > [完整实验脚本](https://www.flagon.io/books/eight-kilobytes/lab/16-btree.sql)
## 索引只存储你交给它的值 {#an-index-stores-exactly-what-you-gave-it}
索引保存的是被索引的值,而不是函数处理后的结果。给列套上一层函数,索引就看不见它了:`where lower(email) = 'user4242@example.com'` 读取了 `users` 的全部 1,126 个页。给这个表达式建索引:
```sql
create index users_lower_email_idx on users (lower(email));
```
现在只读取 4 个页。查询必须使用相同的表达式,写法也要相同;之后运行 `analyze users`,让规划器取得这个表达式的统计信息。
把它设为唯一索引,就能强制执行普通约束无法表达的规则:
```sql
create unique index users_lower_email_key on users (lower(email));
```
现在,`USER4242@example.com` 会因与 `user4242@example.com` 重复而被拒绝。唯一索引本来就能服务查询,所以绝不要“为了性能”,在同一组列上再建一个非唯一索引。
> [!DETAILS]- 深入阅读:为什么不能给 created_at::date 建索引,以及应该怎么写
>
> 索引表达式只接受 `immutable` 函数:输入相同,输出就永远相同。把 `timestamptz` 转换成 `date` 不满足这一条件,因为某个时刻属于哪一天取决于会话的时区,Postgres 会拒绝它,报错 `functions in index expression must be marked IMMUTABLE`。明确写出时区就可以了:`((created_at at time zone 'UTC')::date)`。绝不要把这个转换包装在自己标记为 `immutable` 的函数里来绕过检查:索引中的日期会按写入各行的会话所用的时区计算,而从另一个时区发起的查询会漏掉行。
>
> 对普通列,优先使用 `unique` 表约束,而不是唯一索引:它会显示在 `\d` 中,可以设为可延迟,也能被 `on conflict on constraint` 按名称引用。表达式和带 `where` 子句的情况则使用索引形式。
>
> > [!EXAMPLE]- 动手验证 · lab `16-btree`
> >
> > ```sql
> > select lab.prove('USER4242@example.com is rejected: duplicate key value violates unique constraint "users_lower_email_key"',
> > (select state = '23505'
> > and msg = 'duplicate key value violates unique constraint "users_lower_email_key"'
> > from caught where k = 'unique'));
> >
> > select lab.prove('created_at::date on a timestamptz cannot be indexed: functions in index expression must be marked IMMUTABLE',
> > (select state = '42P17' and msg = 'functions in index expression must be marked IMMUTABLE'
> > from caught where k = 'immutable'));
> > ```
> >
> > [完整实验脚本](https://www.flagon.io/books/eight-kilobytes/lab/16-btree.sql)
## 去重:重复的键只存一次(PostgreSQL 13+) {#deduplication-repeated-keys-are-stored-once-postgresql-13}
`project_id` 上的索引是 14 MB。主键索引同样针对这些行、同样使用 bigint,却有 43 MB。区别在于**去重(deduplication)**:Postgres 只把重复的键存一次,后面跟上具有这个键的行的列表,这能把外键和状态列上的索引缩小到原来的三分之一左右。
更小不代表有用。`kind` 的五个值,每个都至少匹配表中八分之一的行,所以这些行几乎散布在每一页上。仅在 `kind` 上建索引后,查询 `kind = 'alert'` 读取的页甚至比顺序扫描更多。只有少数几个取值的列,应该放在多列索引或部分索引中,绝不要单独建索引。
> [!DETAILS]- 深入阅读:倒排列表的内部结构,以及哪些类型不能去重
>
> 重建 `project_id` 索引时加上 `with (deduplicate_items = off)`,它就会变成 43 MB,和主键索引一样。叶页内部是这样的:
>
> ```text
> index | avg_items | avg_item_bytes
> ---------------------------+-----------+----------------
> events_project_id_idx | 13 | 571
> events_project_id_nodedup | 367 | 16
> ```
>
> 13 个较大的**倒排列表(posting list)**,存下了原本需要 367 个普通条目才能容纳的内容。(`kind` 索引去重后缩小到 13 MB,但 `kind = 'alert'` 的位图扫描仍然访问了表的 35,173 个页中的 35,154 个,再加上 213 个索引页。)
>
> 只要相等的值可能具有不同的字节表示,就不能去重:包括 `numeric`、`jsonb`、`float4` 和 `float8`、数组及其他容器类型,以及使用非确定性排序规则的文本。任何包含 `INCLUDE` 列的索引也不能去重,这也是覆盖索引变大的部分原因。`allequalimage`(见 `bt_metap` 的输出)表明索引是否满足条件;通过 `pg_upgrade` 从 PostgreSQL 12 或更早版本带过来的索引,需要执行 `reindex` 才能使用去重。
>
> > [!EXAMPLE]- 动手验证 · lab `16-btree`
> >
> > ```sql
> > select lab.prove('deduplication makes low-cardinality indexes about three times smaller',
> > pg_relation_size('events_project_id_nodedup')::numeric / pg_relation_size('events_project_id_idx') between 2.8 and 3.4
> > and pg_relation_size('events_kind_nodedup')::numeric / pg_relation_size('events_kind_idx') between 2.8 and 3.6);
> >
> > select lab.prove('so it reads more pages than a sequential scan would',
> > lab.buffers($$ select * from events where kind = 'alert' $$) > 35173);
> > ```
> >
> > [完整实验脚本](https://www.flagon.io/books/eight-kilobytes/lab/16-btree.sql)
## 每个索引都在向写入收税 {#every-index-is-a-tax-on-writes}
每个索引都会让某些读取更快,让每次写入更慢,而且一直如此。我们把同样的 200,000 个事件插入了三次,每次增加一些索引:
| 表上的索引 | 缓冲区访问次数 | WAL 写入量 |
|---|---|---|
| 无 | 211,120 | 32 MB |
| 主键 | 561,333 | 45 MB |
| 主键 + 4 个二级索引 | 2,363,118 | 106 MB |
**Table 17-1.** 每个索引都在向写入收税
四个普通二级索引让同一次插入的缓冲区访问次数变成约四倍,WAL 量超过两倍([先记日志,再写数据](/08-wal/#basics-chapter-8))。
更新也要付费:不改变任何索引列、且新版本能放在原页上的更新是 **HOT** 更新,会跳过所有索引;其他更新都会向每个索引添加一个条目([冷更新会为每个索引付出代价](/07-hot/#a-cold-update-pays-for-every-index))。
> [!NOTE] 索引并不免费
>
> 每次插入、每次非 HOT 更新、每次清理,以及缓存、WAL、副本和备份,都要为每个索引付出代价。为一个明确的查询增加索引,测量前后的差异,删除无人使用的索引。
> [!DETAILS]- 深入阅读:我们如何测量插入税
>
> 每轮都用 `explain (analyze, buffers, wal)` 执行相同的插入;两轮之间执行 `truncate events_w` 并增加索引:
>
> ```sql
> create table events_w (like events including defaults);
> explain (analyze, buffers, wal, costs off)
> insert into events_w select * from events where id <= 200000;
> -- run 2: alter table events_w add primary key (id);
> -- run 3: plus (project_id, created_at), (account_id, created_at),
> -- (user_id), (created_at)
> ```
>
> 每个索引项都要单独沿树下行,弄脏自己的页,生成自己的 WAL 记录。各轮的 WAL 量会相差几 MB,取决于插入过程中是否碰上检查点,迫使它生成整页镜像;缓冲区计数则不会变化。UUIDv4 这样的随机键会让这笔税更重,因为每次插入都会落到不同的叶页([递增键追加;随机键落在任何位置](/13-keys/#increasing-keys-append-random-keys-land-anywhere))。
>
> > [!EXAMPLE]- 动手验证 · lab `16-btree`
> >
> > ```sql
> > -- tax holds (k, buffers, wal) from lab.plan() of each insert
> > select lab.prove('four secondary indexes made the insert touch about four times as many buffers',
> > (select a.buffers::numeric / b.buffers between 3.5 and 5 from tax a, tax b where a.k = 'pk+4' and b.k = 'pk'));
> >
> > select lab.prove('and more than doubled its WAL',
> > (select a.wal / b.wal > 2 from tax a, tax b where a.k = 'pk+4' and b.k = 'pk'));
> > ```
> >
> > [完整实验脚本](https://www.flagon.io/books/eight-kilobytes/lab/16-btree.sql)
## idx_scan 为零只是疑点,不能据此定案 {#an-idx_scan-of-zero-is-a-suspect-not-a-verdict}
添加索引只需一行代码,却从来没人删除索引。`pg_stat_user_indexes` 统计每个索引的扫描次数,因此 `idx_scan` 为零的索引值得怀疑。在删除它之前:
- **检查计数器已运行多久**(`stats_reset`,见 `pg_stat_database`)。月末报表用的索引,有 29 天看起来都没人用。PostgreSQL 16+ 的 `last_idx_scan` 会显示每个索引上次使用的时间,比重置日期更容易判断。
- **检查每个副本。** 计数器按服务器独立统计;主库上闲置的索引,可能在每个副本上都承担着重任。
- **不要动唯一索引和主键索引。** 它们负责强制执行约束。
- **用 `drop index concurrently` 删除**([变更模式,服务照常](/26-migrations/#basics-chapter-26)),并把 `create index` 语句留在手边。
重复索引就没那么难判断了。有人为外键添加 `(project_id)`,后来又有人为仪表板添加 `(project_id, created_at)`,第一个索引现在就只剩写入成本了:较长索引可以服务较短索引所能服务的每一种查找。
> [!DETAILS]- 深入阅读:两条查询找出待删除的索引
>
> 未使用的索引,按大小从大到小排列:
>
> ```sql
> select s.relname as table_name, s.indexrelname as index_name, s.idx_scan,
> pg_size_pretty(pg_relation_size(s.indexrelid)) as size
> from pg_stat_user_indexes s
> join pg_index i on i.indexrelid = s.indexrelid
> where s.idx_scan = 0 and not i.indisunique and not i.indisprimary
> order by pg_relation_size(s.indexrelid) desc;
> ```
>
> ```text
> table_name | index_name | idx_scan | size
> ------------+------------------------+----------+-------
> events | events_created_at_idx | 0 | 43 MB
> events | events_project_id_idx2 | 0 | 14 MB
> ```
>
> 第二行是我们故意放进去的 `project_id` 索引的复制品。第一行是比较部分索引时使用的 `(created_at)` 索引:我们只对它运行过 `explain`,没有带上 `analyze`,这不会执行查询,因此从未计为一次扫描。
>
> 键列是另一个索引键列前缀的索引:
>
> ```sql
> select a.indrelid::regclass as table_name,
> a.indexrelid::regclass as redundant,
> b.indexrelid::regclass as covered_by
> from pg_index a
> join pg_index b
> on b.indrelid = a.indrelid
> and b.indexrelid <> a.indexrelid
> and b.indnkeyatts >= a.indnkeyatts
> and (b.indkey::text || ' ') like (a.indkey::text || ' %')
> where not a.indisunique
> and a.indnatts = a.indnkeyatts
> and a.indpred is null and b.indpred is null
> and a.indexprs is null and b.indexprs is null
> and (a.indkey::text <> b.indkey::text or a.indexrelid > b.indexrelid)
> order by 2, 3;
> ```
>
> ```text
> table_name | redundant | covered_by
> ------------+------------------------+----------------------------
> events | events_project_id_idx | events_project_created_idx
> events | events_project_id_idx2 | events_project_id_idx
> events | events_project_id_idx2 | events_project_created_idx
> ```
>
> 它只比较列号(不比较操作符类、排序规则或排序方向),并跳过部分索引和表达式索引,因此行动前要逐项检查查询结果。
>
> > [!EXAMPLE]- 动手验证 · lab `16-btree`
> >
> > ```sql
> > select lab.prove('events_created_at_idx shows up too: EXPLAIN without ANALYZE never counts as a scan',
> > (select idx_scan = 0 from pg_stat_user_indexes where indexrelname = 'events_created_at_idx'));
> > ```
> >
> > [完整实验脚本](https://www.flagon.io/books/eight-kilobytes/lab/16-btree.sql)
## 从查询出发设计索引,而不是从列出发 {#design-an-index-from-a-query-not-a-column}
1. **从查询出发,而不是从列出发。** 从 `pg_stat_statements` 获取真实 SQL([从 pg_stat_statements 开始](/31-observability/#start-with-pg_stat_statements)),记下它的计划访问了多少页。
2. **等值列放在前面**,然后放一列用于范围查询或 `order by`,让索引完成排序。
3. 针对固定的数据子集,**考虑部分索引**;只有非常热门的查询才考虑 `INCLUDE`。
4. **检查已有索引**中,哪些会因新索引而变得冗余。
5. **用 `create index concurrently` 建立索引**([根据表的流量选择索引构建方式](/26-migrations/#pick-the-index-build-that-matches-the-tables-traffic)),并比较页数。没有减少一个数量级?决定保留它之前,先弄清原因。
## 本章要点 {#the-short-version}
- 一次查找的成本,是树的深度(3 或 4 个页),加上每个匹配行对应的一个堆页。
- 为问题建索引:先等值列,再放一个范围或排序列。错误的顺序会把 14 个页变成 643 个页。
- 仅索引扫描需要及时更新的可见性映射。关注 `Heap Fetches`。
- 部分索引小而便宜;把它的谓词写成字面量。
- 绝不要为只有少数几个取值的列单独建索引。
- 每个索引都向每次写入收税:多加四个索引,插入的缓冲区访问次数就变成四倍。
- 在足够长的时间窗口内,在每个副本上审查 `idx_scan = 0`。
## 延伸阅读 {#further-reading}
- [Indexes](https://www.postgresql.org/docs/18/indexes.html),PostgreSQL 文档。官方章节,涵盖多列索引、仅索引扫描、部分索引和表达式索引。
- [B-Tree Indexes: implementation](https://www.postgresql.org/docs/18/btree.html#BTREE-IMPLEMENTATION),PostgreSQL 文档。结构、去重和自底向上删除。
- [src/backend/access/nbtree/README](https://github.com/postgres/postgres/blob/master/src/backend/access/nbtree/README),PostgreSQL 源码。由实现者介绍右向链接、高键和页删除。
- [Efficient Locking for Concurrent Operations on B-Trees](https://www.csd.uoc.gr/~hy460/pdf/p650-lehman.pdf),Philip L. Lehman 和 S. Bing Yao,ACM TODS,1981。Postgres 兄弟节点链接背后的 B-link 树。
- [PostgreSQL 18 release notes](https://www.postgresql.org/docs/18/release-18.html),PostgreSQL。跳跃扫描和新增的 `Index Searches` 行。
- [Anatomy of an SQL Index](https://use-the-index-luke.com/sql/anatomy),Markus Winand。对叶页链和树深度最清晰的思维模型。